quick or slow
? The ZFs monitoring dashboard is available on grafana.com, and there is a GitHub page for issues and feedback
I’ve been wanting to monitor ZFS latencies, and found Richard Elling’s tool for exporting that data to influxdb. The dashboards for it are written for InfluxDB v1, whereas I run v2. Part 1 goes over setup and data ingress; then Part 2 covered getting to grips with flux to start porting to v2. Part 3 gets into the meat of porting- variables, panels, better heatmaps. Part 4 tidies up by reducing repetition in panels, queries, constants and functions. Part 5 covers publishing and a short reflection/retrospective.
Context + zpool iostat
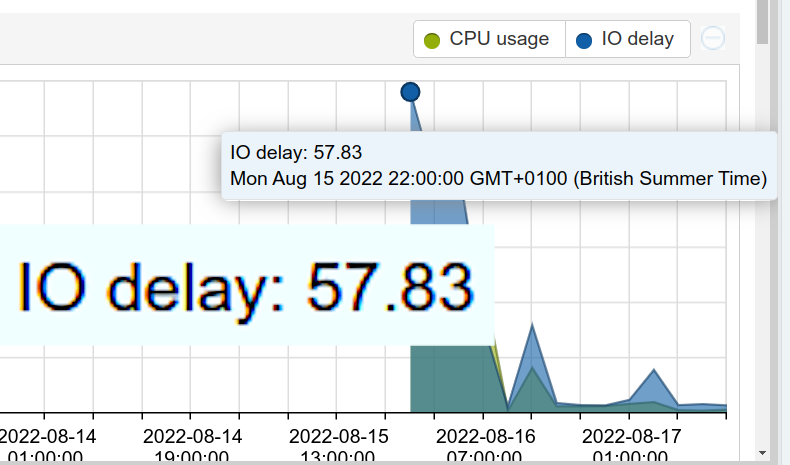
Recently I noticed some high IO delay on a proxmox host:
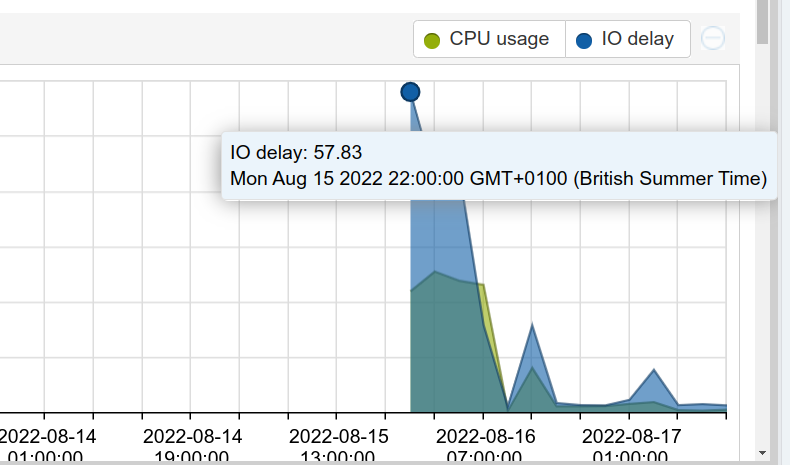
Naturally I turned to resident ZFS expert and sneaky fox Bob, who pointed me at zpool iostat, and it’s histogram mode, -w. Here’s how the iostat histogram for the whole tank looks for mine at present:
root@artemis:# zpool iostat -v -w

tank                                   total_wait     disk_wait    syncq_wait    asyncq_wait
latency                                read  write   read  write   read  write   read  write  scrub   trim
------------------------------------  -----  -----  -----  -----  -----  -----  -----  -----  -----  -----
1ns                                       0      0      0      0      0      0      0      0      0      0
3ns                                       0      0      0      0      0      0      0      0      0      0
7ns                                       0      0      0      0      0      0      0      0      0      0
15ns                                      0      0      0      0      0      0      0      0      0      0
31ns                                      0      0      0      0      0      0      0      0      0      0
63ns                                      0      0      0      0      0      0      0      0      0      0
127ns                                     0      0      0      0      0      0      0      0      0      0
255ns                                     0      0      0      0      2      0     97    226     25      0
511ns                                     0      0      0      0  25.8K   259K   442K   447K  45.5M      0
1us                                       0      0      0      0  48.0K  80.5K   250K  2.49M  33.8M      0
2us                                       0      0      0      0  19.9K  13.6K   179K  1.35M  4.55M      0
4us                                       0      0      0      0  1.17K  3.02K  28.9K  68.1K   638K      0
8us                                       0      0      0      0    301  2.27K  2.60K  69.1K  1.20M      0
16us                                      0      0      0      0    271  2.07K  1.45K   155K  1.80M      0
32us                                  53.0K      5  59.6K      6     10     24    237   427K  3.44M      0
65us                                   800K    377   830K    414     19     16    205   848K  13.7M      0
131us                                 10.0M  34.9K  10.2M  36.4K     26     35  1.07K   705K  23.1M      0
262us                                 34.0M   148K  35.3M   269K     23    118  1.68K   525K  19.0M      0
524us                                 30.0M   563K  31.7M  2.80M     37    131  1.13K   811K  7.56M      0
1ms                                   21.7M  1.98M  23.1M  3.89M     52    143    549  1.49M  8.06M      0
2ms                                   29.4M  3.13M  30.6M  3.26M     92     65    331  2.13M  5.73M      0
4ms                                   29.5M  3.09M  27.7M  2.06M     84     13    436  2.83M  3.95M      0
8ms                                   12.1M  5.16M  12.2M  5.35M    105     13    666  2.58M  3.74M      0
16ms                                  5.99M  2.84M  5.64M  2.21M    118      9    917  1.17M  1.57M      0
33ms                                  4.08M  1.58M  2.98M   115K     73      5    695   514K   655K      0
67ms                                  1.51M   693K   345K   133K     24      2    319   480K   302K      0
134ms                                  271K   364K  18.7K  56.1K      1      2    175   234K   229K      0
268ms                                  275K   134K  3.21K  1.77K      0      2     34   127K   262K      0
536ms                                  276K   118K    405     45      0      0     10   118K   267K      0
1s                                     223K   127K    706     24      0      0     69   126K   217K      0
2s                                     229K   101K      6      0      0      0      0   101K   228K      0
4s                                     166K  91.8K      0      0      0      0      0  91.7K   165K      0
8s                                    23.5K  60.9K      0      0      0      0      0  60.7K  23.2K      0
17s                                     532  6.99K      0      0      0      0      0  6.96K    530      0
34s                                     171      0      0      0      0      0      0      0    171      0
68s                                      24      0      0      0      0      0      0      0     24      0
137s                                      0      0      0      0      0      0      0      0      0      0
----------------------------------------------------------------------------------------------------------
It also gives a breakdown on a per-device basis, which is helpful for figuring out which one is slowing down the pool. Hint: it’s probably an SMR drive. I returned 2 drives not listed as SMR and replaced them with CMR, which took away the worst of the IO wait, but some remained.
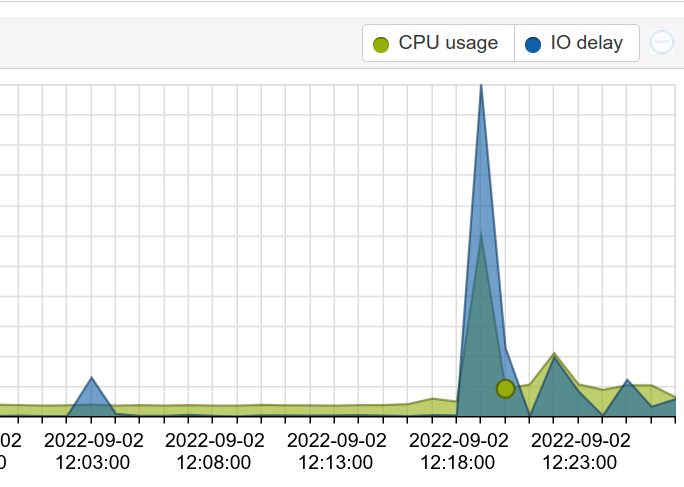
Since I was still facing IO delay spikes, I wanted something that would let me see if it was getting worse, staying the same, or just popping up from time to time.
Monitoring over time with zpool_influxdb
Surely, I said to myself, surely someone’s written something to track stats over time. Indeed they have!
Richard Elling wrote the great tool, zpool_influxdb (GitHub). it does exactly what it says, producing metrics that can be consumed by influxdb and displayed nicely with grafana. That’s perfect, as I already have a running TIG stack from a while back.
The zfs version included with proxmox (zfs-2.1.4-pve1) includes zpool_influxdb, we’re almost ready to go off the bat! Do note that the tool is not in $PATH by default, so don’t panic if you see:
# zpool_influxdb
bash: zpool_influxdb: command not found
Don’t worry, it is there! It can be found at /usr/lib/zfs-linux/zpool_influxdb (tip: $ find / -type f -iname zpool_influxfb). If you run it without arguments – which it is safe to do – it should produce a bunch of output on stdout which I will not reproduce here.
Gathering Metrics on Proxmox with Telegraf
Now that we have the tool and an influxdb2 instance, we just need to get the metrics from one to the other. Telegraf is ideal for this.
Speaking of ideal, there’s a great post by Alexander Dunkel on setting up up telegraf on proxmox. Go read that, as it tells you everything you need to know. Seriously.
Now that you’ve done that you can add the config for gathering metrics from zpool_iostat to /etc/telegraf/telegraf.conf:
[[inputs.exec]]
  commands = ["/usr/lib/zfs-linux/zpool_influxdb"]
  timeout = "5s"
  data_format = "influx"
start/reload telegraf, and you’ll start getting zfs metrics!
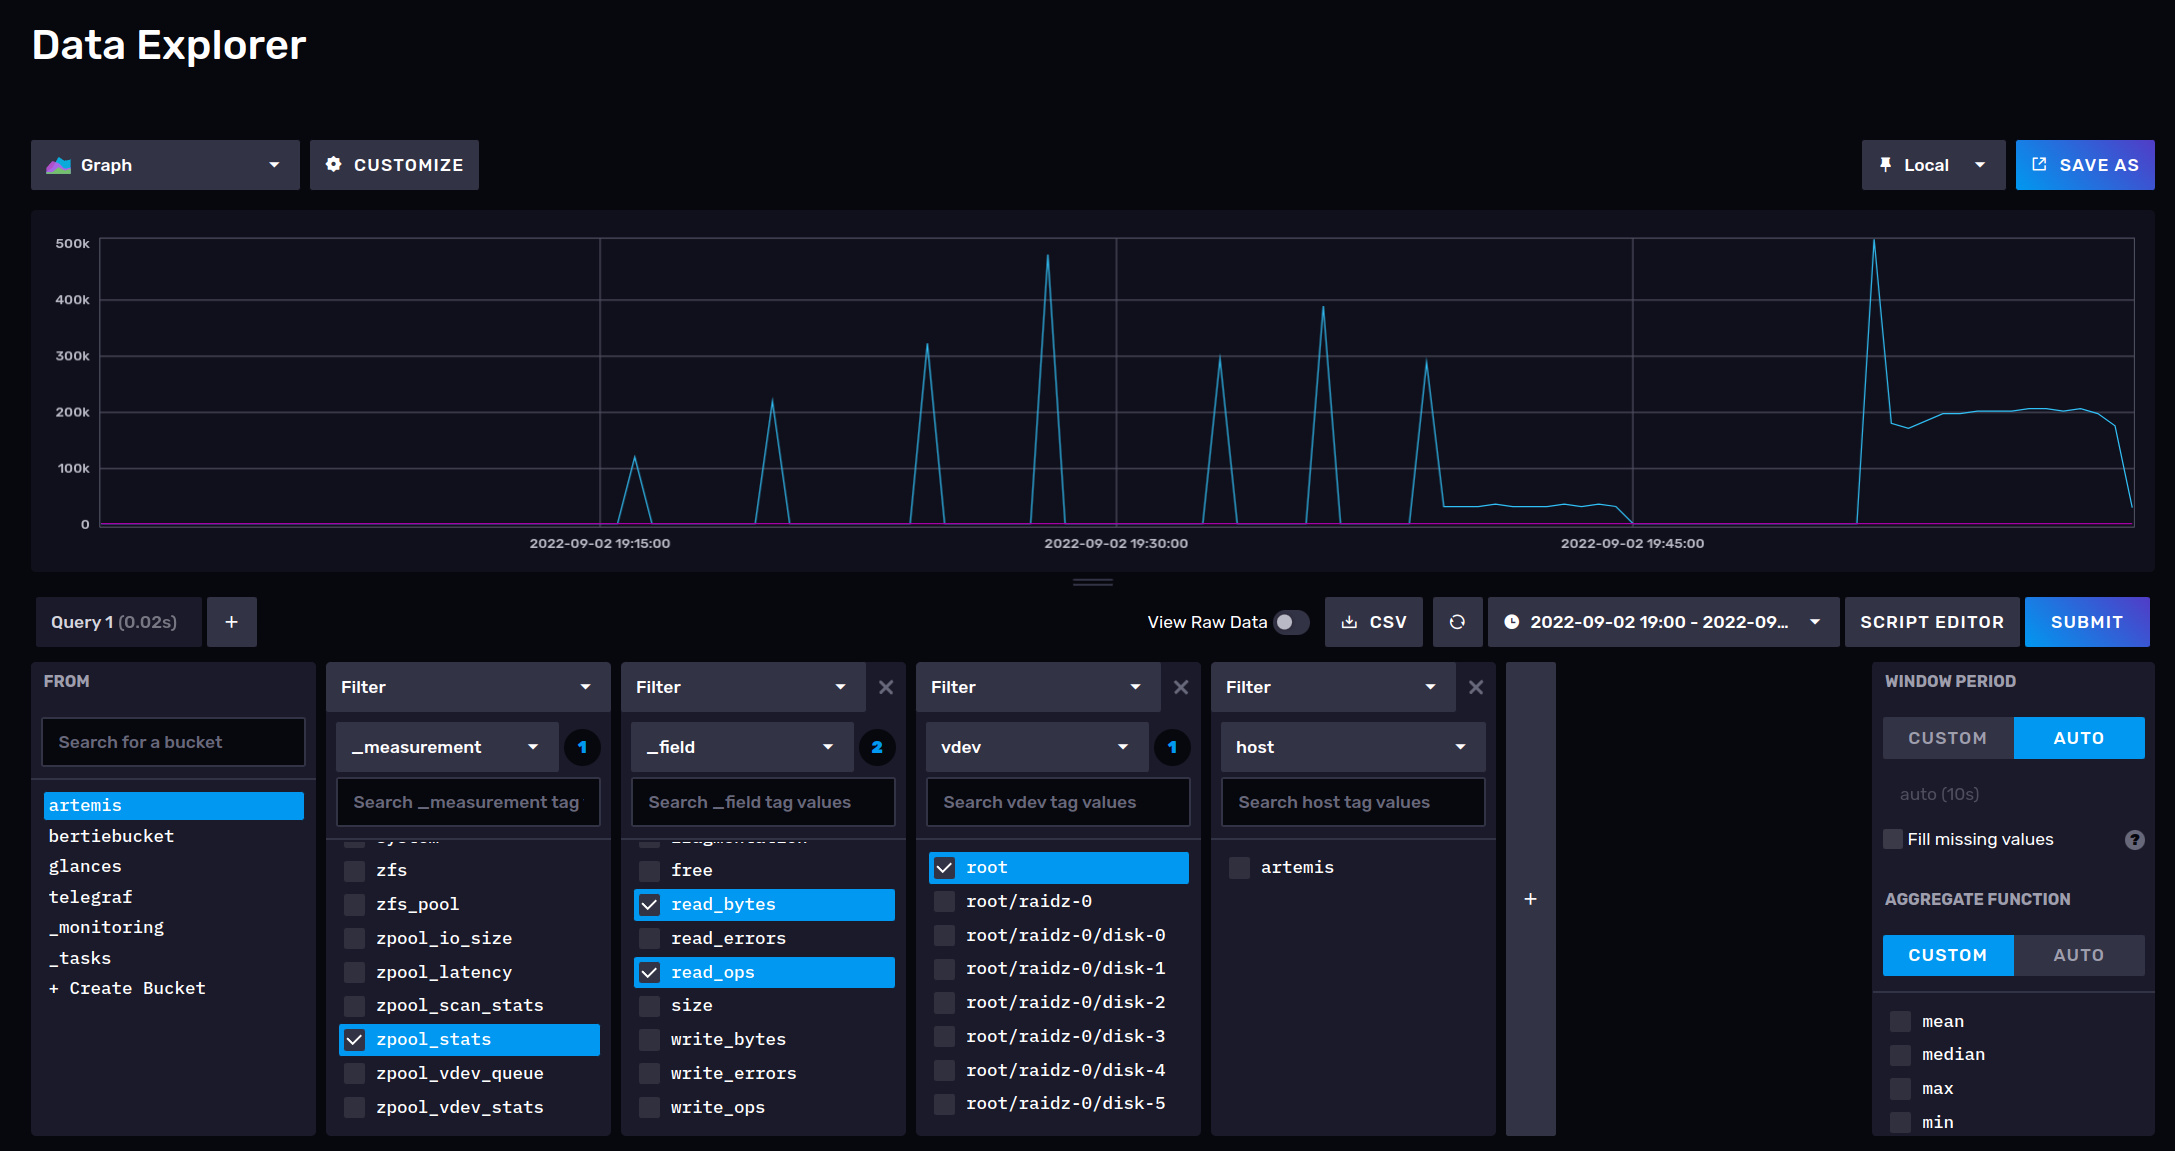
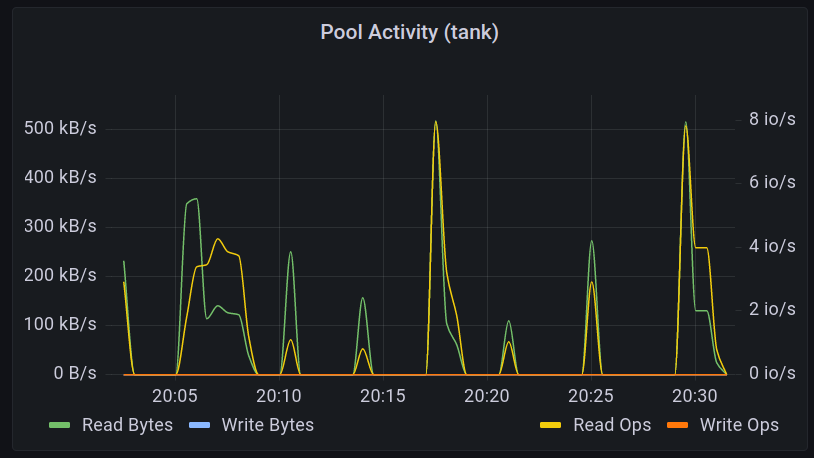
Next time: getting dirty with grafana to migrate a dashboard to influxdb2 (flux) queries. Sneak preview:
Pingback: Monitoring ZFS with InfluxDB & Grafana: Graph Time (Part 2) – Rob's Blog
Pingback: Monitoring ZFS with InfluxDB & Grafana: Adapting Panels to flux (Part 3) – Rob's Blog