getting it out the door
Context
? The ZFs monitoring dashboard is available on grafana.com, and there is a GitHub page for issues and feedback
I’ve been wanting to monitor ZFS latencies, and found Richard Elling’s tool for exporting that data to influxdb. The dashboards for it are written for InfluxDB v1, whereas I run v2. Part 1 goes over setup and data ingress; then Part 2 covered getting to grips with flux to start porting to v2. Part 3 gets into the meat of porting- variables, panels, better heatmaps. Part 4 tidies up by reducing repetition in panels, queries, constants and functions. Part 5 covers publishing and a short reflection/retrospective.
Adding a Variable for Bucket Selection
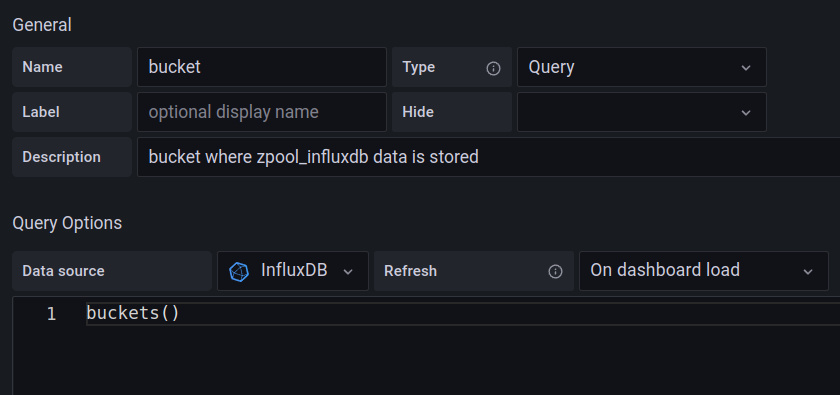
In Part 3 we updated the dashboard’s variables for host and poolname to flux. But we still have the bucket hard-coded into every query- we should pull that out into a variable. Helpfully, there is a sample query for exactly that:
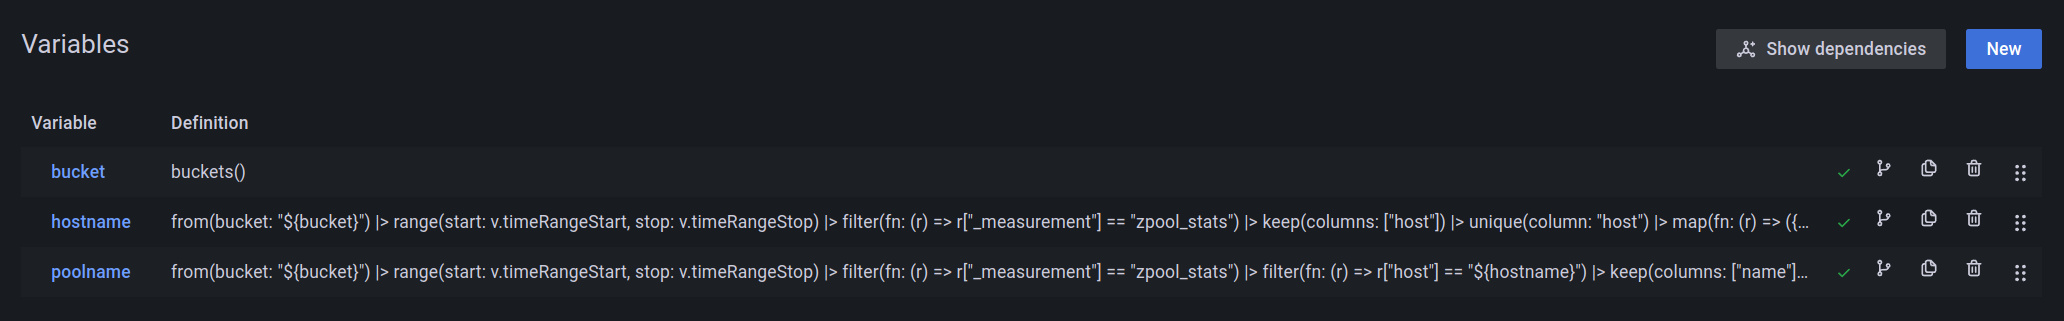
We can then update every query with this variable- including the other two variables!
Now we need to update 29 panels’ worth of queries! But there may be some additional changes to queries we can make while we’re at it.
Sharing Code Between Panels
There’s quite a bit of reuse in the queries, particular in things which could be defined as a constant (ie which columns to keep), and as a custom function (ie the niceify_legend function). It’s good practice to reduce duplication, particularly as it is tedious to update all instances when a change is made.
Templating via Repeated Panels
Grafana has a neat option to repeat panels, with a post on the ‘Learn Grafana’ blog about how to use them. Repeated panels use a variable to create variants of panels based on the contents of the variable.
A classic example would be for server monitoring- say you have a bunch of servers, and you have a query that pulls out a time series line graph of CPU activity over time. You can use a variable with the server names and use that variable in the query — just as we’ve done with host and poolname — and grafana will create a panel with each server you select in the variable.
You can also do this with rows to duplicate-with-modifications collections of panels, and we’re going to use these to recreate the bottom twelve panels on Scott MacDonald’s dashboard to a single query.
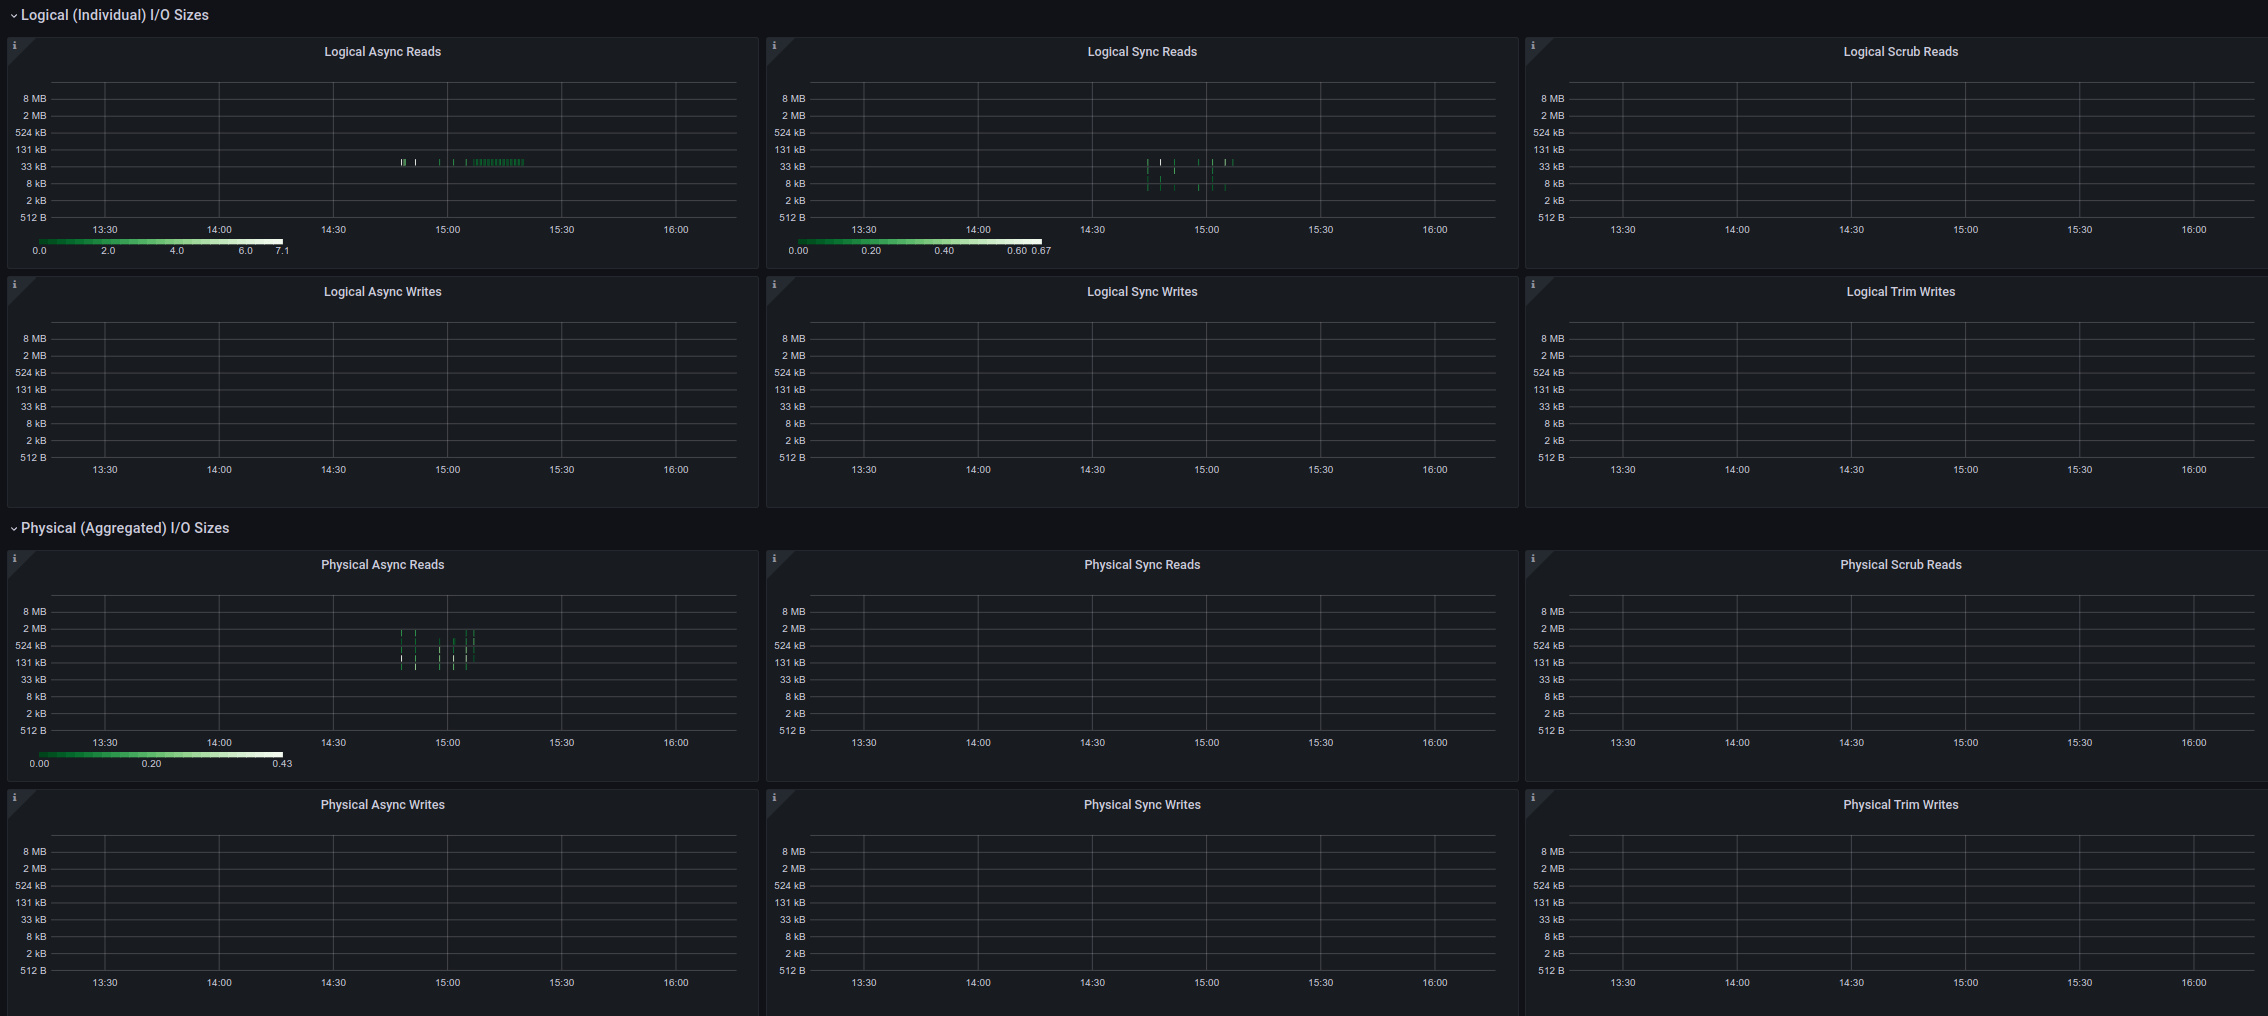
How? Observe each of the single parameters for those panels:
$ grep -E '_ind|_agg' zfs-pool-metrics_rev1.json
                      "async_read_ind"
                      "sync_read_ind"
                      "scrub_read_ind"
                      "async_write_ind"
                      "sync_write_ind"
                      "trim_write_ind"
                      "async_read_agg"
                      "sync_read_agg"
                      "scrub_read_agg"
                      "async_write_agg"
                      "sync_write_agg"
                      "trim_write_agg"
We have six versions of each metric: [a]sync read/write plus scrub read and trim write; both in individual and aggregate. So we create two variables for each of those:
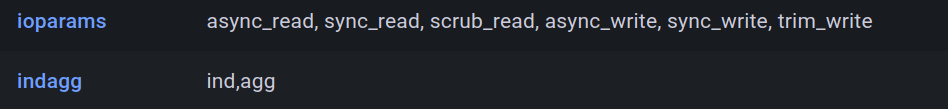
The former will create six panels, the latter will create two rows.
We can add a row repeat for the latter ($indagg) and a panel repeat for the former ($ioparams); and the query can reference both:
RawData = from(bucket: "${bucket}")
  |> range(start: v.timeRangeStart, stop: v.timeRangeStop)
  |> filter(fn: (r) => r["_measurement"] == "zpool_io_size")
  |> filter(fn: (r) => r["vdev"] == "root")
  |> filter(fn: (r) => r["_field"] == "${ioparams}_${indagg}") |> derivative(nonNegative: true)
  |> aggregateWindow(every: v.windowPeriod, fn: mean, createEmpty: false)
(a few lines elided)
The two variables are referenced in r["_field"] == "${ioparams}_${indagg}"; these will expand as the panels repeat, creating 6 panels.
Caveat: I had wanted to do this transparently by hiding the variables, but it seems that there’s no way to have the panels repeat automatically for all values in a variable – even as far back as 2017. Instead, the workaround is to make the variable visible, check all, then hide it. I may leave the variables non-hidden if people want to reduce what they see or generally play with them.
We can also do the same thing for the eight individual metrics in the latencies row, which requires another variable for the extra two parameters: disk_read and disk_write. It’s getting crowded in the variables!

Defining Columns to Retain Once
At present we have repeated definitions of KEEPCOLS. We can use hidden variables for this- one for time series data, one for the heatmaps. Note that the comma separating the column strings has to be escaped with a backslash:

The downside to this is it hurts discoverability: someone coming to this dashboard now needs to look at a variable to see what columns are being retained, as opposed to simply looking at the query. I could be persuaded either way as to whether this is a dealbreaker for making the change.
Sharing Functions
Since we can use a dashboard template variable to assign a variable’s value, can we do the same with a function? Yes!

This feels even more dirty, so I asked in #grafana if it was good practice. On the plus side, it does mean the function is defined in one place, so can be updated there.
We’re about good to publish!