one panel at a time
Context
? The ZFs monitoring dashboard is available on grafana.com, and there is a GitHub page for issues and feedback
I’ve been wanting to monitor ZFS latencies, and found Richard Elling’s tool for exporting that data to influxdb. The dashboards for it are written for InfluxDB v1, whereas I run v2. Part 1 goes over setup and data ingress; then Part 2 covered getting to grips with flux to start porting to v2. Part 3 gets into the meat of porting- variables, panels, better heatmaps. Part 4 tidies up by reducing repetition in panels, queries, constants and functions. Part 5 covers publishing and a short reflection/retrospective.
Continuing Dashboard Port to V2
Variables
We haven’t yet touched these – as they can be filled in manually – but the dashboard also includes two variables: host and poolname. These get used in panel titles and queries. They were originally written in influxQL for v1 but we can update them.
As they were:

Those queries will need updated to flux versions, and there’s a small gotcha! I’ll walk you through ‘host’:
from(bucket: "artemis")
  |> range(start: v.timeRangeStart, stop: v.timeRangeStop)
  |> filter(fn: (r) => r["_measurement"] == "zpool_stats")
  |> keep(columns: ["host"])
  // I'm not sure if the 'unique' is necessary, but it feels more understandable to only use unique values
  |> unique(column: "host")
  // We remap the resulting 'host' column to the special '_value' so the grafana enumerator can understand it and list options
  |> map(fn: (r) => ({_value: r["host"]}))
  |> yield(name: "host")
Grafana would refuse to list the options in the variable drop down had we not used map()! ‘poolname’ is the same: filter on name, and also filter what the host variable is set to- this means data from different hosts can be included in the same bucket, should you want to.
Stat Panels
Chris MacDonald’s dashboard included a middle set of panels for reporting the health of the pool:
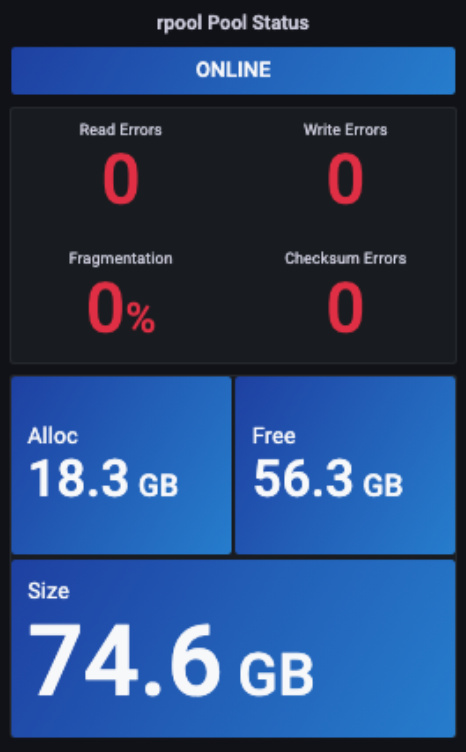
It looks pretty neat. Replicating most of this wasn’t too bad, but the top one proved kinda tricky. We’ll deal with that first. The panels have calculations set up, in the case of the status panel this is:

So it’s using the Last * (last non-null) function to pull out of the state field. Seems easy! The state field is present across several of the zpool_stat metric sets. The JSON for the v1 version pulls from size, so we can too:
from(bucket: "artemis")
  |> range(start: v.timeRangeStart, stop: v.timeRangeStop)
  |> filter(fn: (r) => r["_measurement"] == "zpool_stats")
  |> filter(fn: (r) => r["name"] == "${poolname}")
  |> filter(fn: (r) => r["host"] == "${hostname}")
  |> filter(fn: (r) => r["vdev"] == "root")
  |> filter(fn: (r) => r["_field"] == "size")
Which should give us a result set with a bunch of stuff, including a state column. But it actually gives us a massive No data 🙁 What gives? Diving into the raw data can help see what is actually being produced- is it actually no data (an empty set); or is something not recognised? Sometimes checking the same query in infludxdb is also helpful, so we’ll check both.
infludb data table:
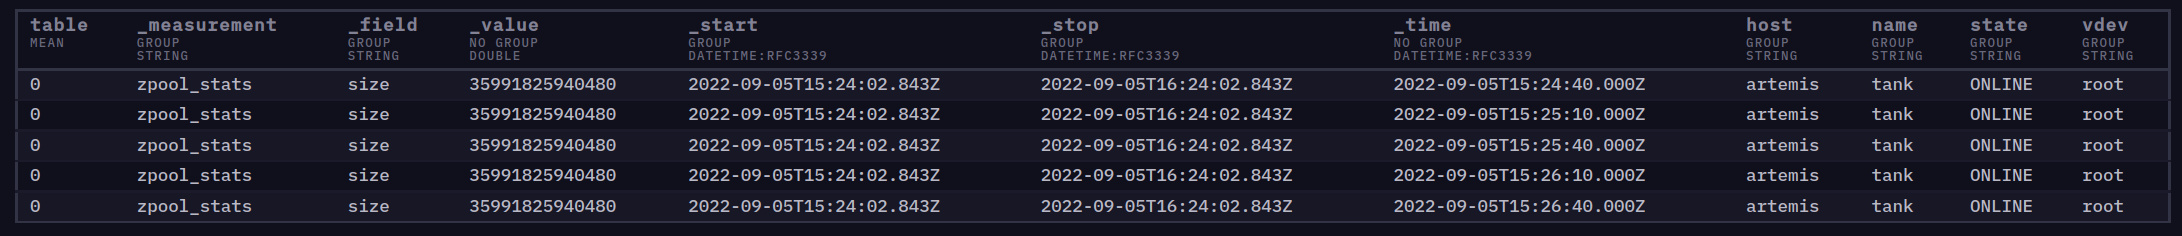
That actually looks alright? We should just be able to keep() (or map()) the _time and state fields. But doing that just makes both influxdb and grafana complain about an internal error.
grafana data table:
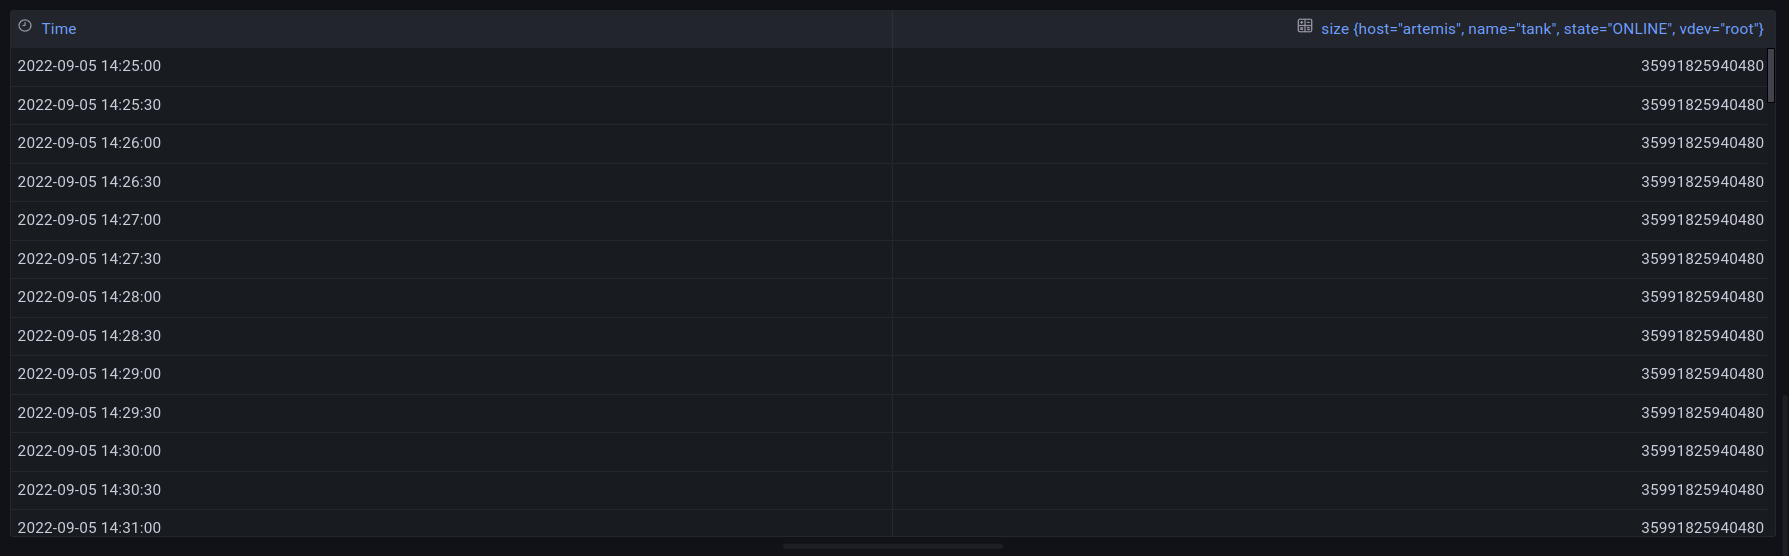
Ah, grafana is processing the data somehow- pulling out _value and showing everything else into the column name? I had a read through the query overview docs and the related glossary entries, but at time of writing I’m still not sure exactly why it processes it that way. I have an inkling that for some reason it’s treating _time and _value as special columns, which probably makes sense for some shorthands, but the reason for the internal error is opaque to me. I will ask a question on the grafana forums to make sense of it.
After muddling with map(), last(), and pivot() I wasn’t getting anywhere useful in a hurry. Thankfully a post on the grafana forums pointed me in the right direction. The combination of map and pivot seemed to work well. I inserted the following in the data processing:
    |> map(fn: (r) => ({r: r._time, c: "state", v: r["state"]}))
    |> pivot(rowKey: ["r"], columnKey: ["c"], valueColumn: "v")
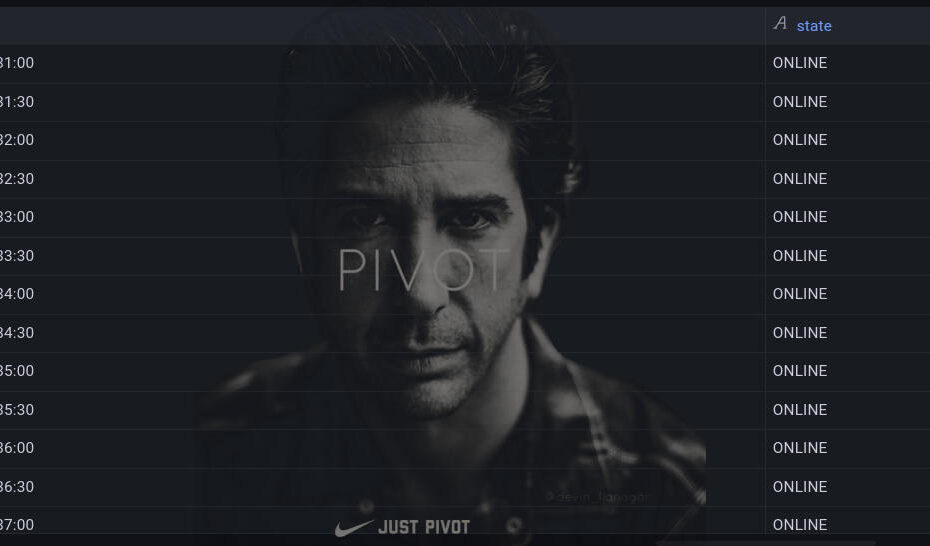
and so:

Now the panel can pull the value from state just fine!
Improving The Latency Heatmaps
As I mentioned in the last post, my ZFS pool doesn’t see a lot of read/write activity most of the time; at least not yet. So heatmaps of the derivative tend to look rather sparse:
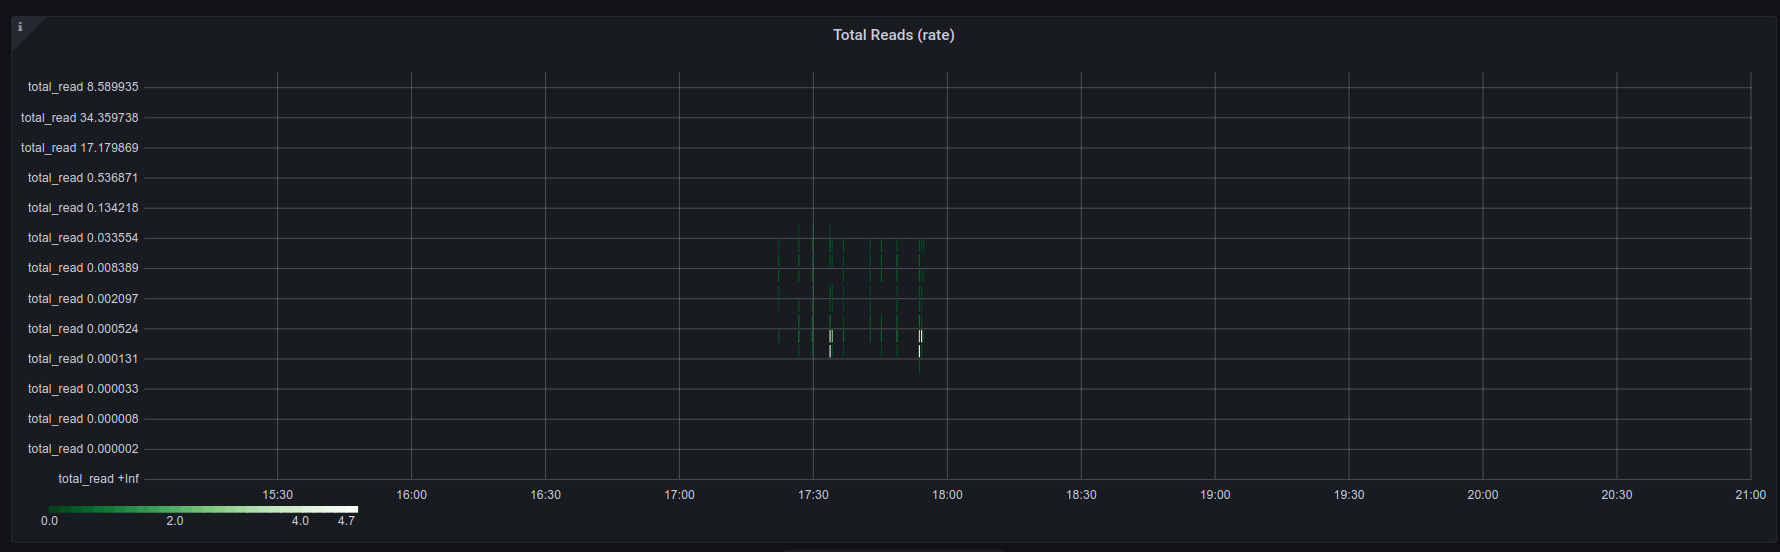
I had to zoom out to “last 6 hours” just to get any data!
That said, it’s probably worth doing. I am interested in change (not the absolute rate), and so seeing a more populated heatmap doesn’t tell me anything that I’m actually interested in. I will likely create a separate panel/dashboard for tracking the higher latency buckets over time, however, as that will be easier to keep track of.
Having updated the heatmap to show the derivative I updated the title to reflect that we’re seeing total read latency rate.
We also need to sort the Y axis. It looks similar to what we saw with the state panel above, and the time series panels in the previous post- there’s ‘too much’ being returned. We can drop the _field column, so we instead have KEEPCOLS = ["_time", "_value", "le"], giving us:
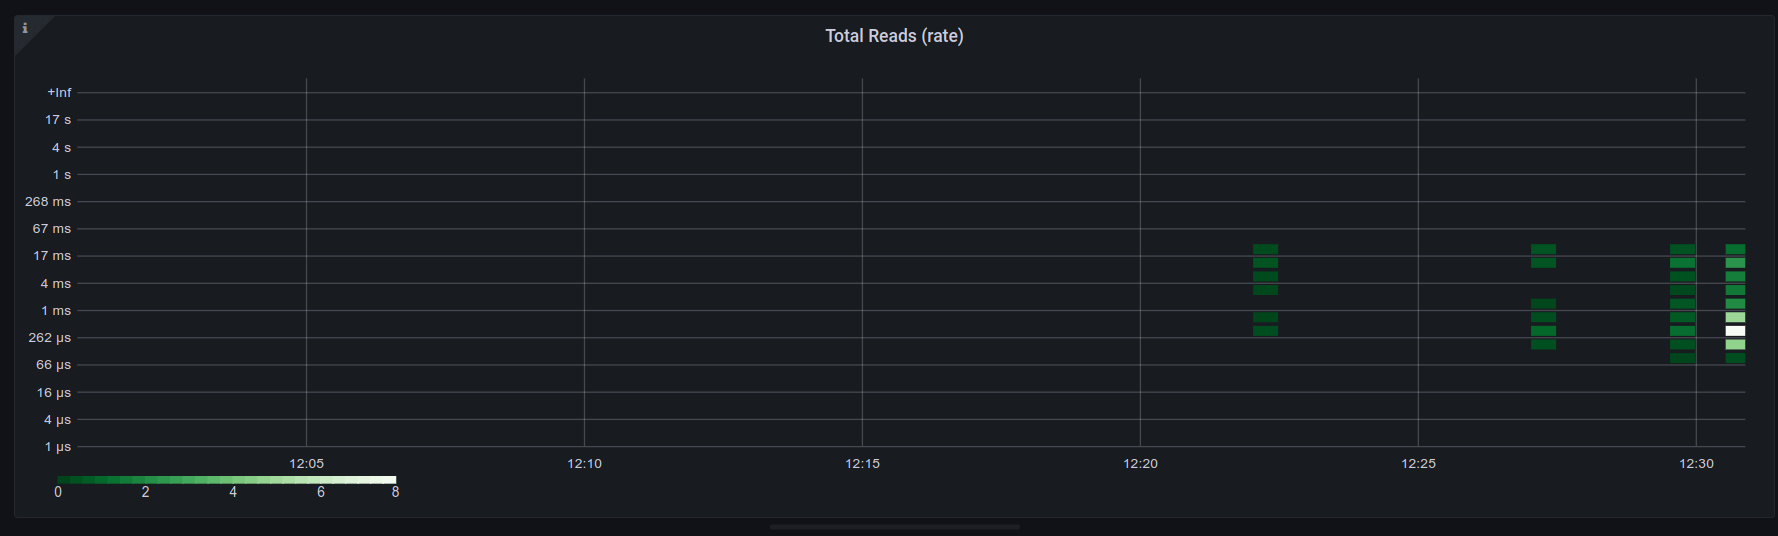
Still sparse, but looking good!
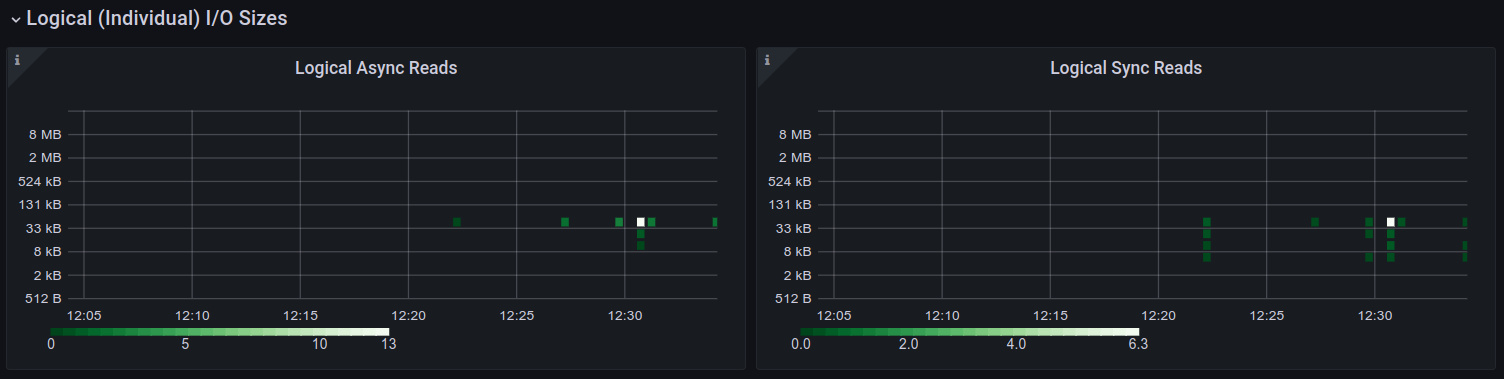
Other Panels
We still have the bottom eight panels to finish off in the latency part, then the logical and physical sections. All of those panels are derivative heatmaps for a single metric. Completing them is as simple as looking at the JSON for the parameter for each panel.
Wrapping Up
That’s it! All the panels and the variables have been ported to influxdb v2’s flux queries, and produce data. All that’s left to do is polish up some things and this dashboard is ready to go. Then comes Richard Elling’s own dashboard!