going public
Context
? The ZFs monitoring dashboard is available on grafana.com, and there is a GitHub page for issues and feedback
I’ve been wanting to monitor ZFS latencies, and found Richard Elling’s tool for exporting that data to influxdb. The dashboards for it are written for InfluxDB v1, whereas I run v2. Part 1 goes over setup and data ingress; then Part 2 covered getting to grips with flux to start porting to v2. Part 3 gets into the meat of porting- variables, panels, better heatmaps. Part 4 tidies up by reducing repetition in panels, queries, constants and functions. Part 5 covers publishing and a short reflection/retrospective.
Download
(direct link to JSON)
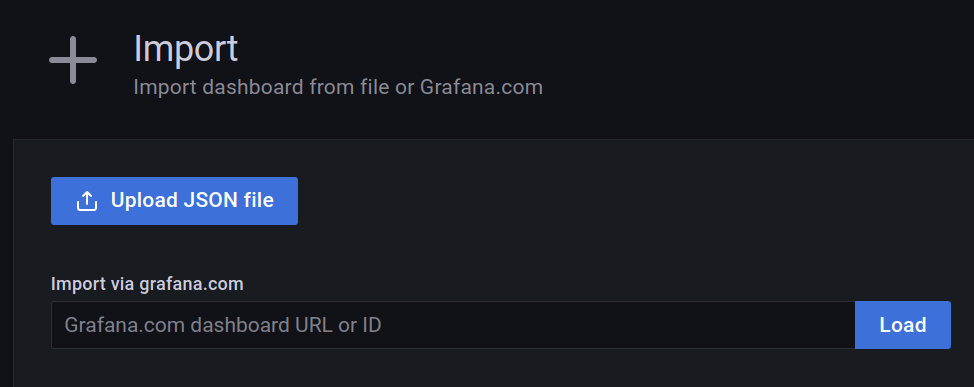
This file can be imported via Dashboards ? + Import (on the left hand panel), then ‘Upload JSON file’:
Publishing
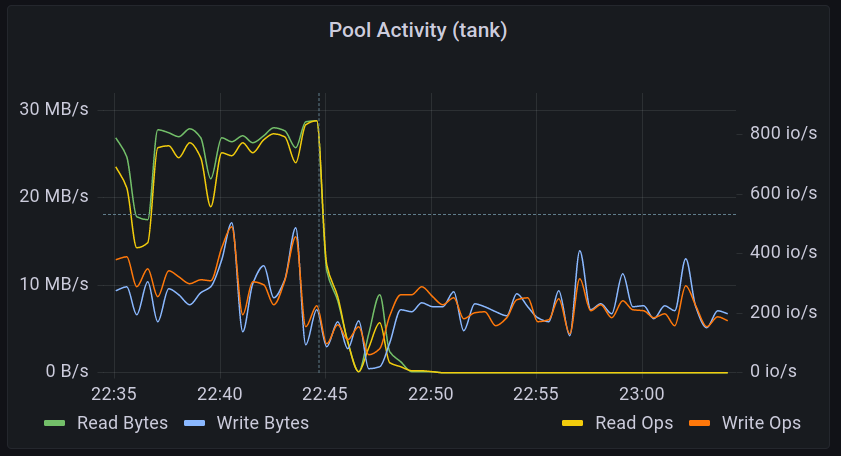
The state we left the dashboard in after moving constants and functions to variables is pretty much ready to go out the door. During the course of porting I also updated the title and description, and set the date/time range to “last hour”, rather than a specific date/time rage as-was. I presume that’s when there was a nice burst of activity that made for a good example screenshot.

Publishing to Grafana Community
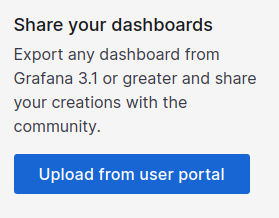
I’d like to push this to Grafana.com for better discoverability. At time of writing I have been unable to publish to Grafana Community. Despite signing up when I click the button for sharing dashboards, I get a 404:

I tweeted to @Grafana and asked on the IRC channel. One of the FE folks said they would ask the team and get back to me (or someone else would) but I’ve yet to hear- I’ll follow up after the weekend.
In the meantime I will publish here (see the Download section above) and also push it out to GitHub when I get a chance.
Edit: there was some back and forth, but no further update, so I’m publishing here for the moment. I may post about my sharing issue on the grafana forums, as I’d prefer this dashboard have good discoverability so that someone else doesn’t spend time re-doing what I did.
Reflection
Overall, I am pleased with how this turned out. It took an investment of time, but in doing so I have learned about:
- flux query basics
- taking derivatives of saved data to determine rate / change
- discovered idiosyncrasies of how Grafana handles tables returned by queries slightly differently to InfluxDB
- discovered panel repeats and set up variables to better reuse constants, functions and panel setups
As a result I feel more confident in being able to both adapt existing dashboards to my use (or port them if necessary) and to create panels and dashboard from scratch for my own purposes.
Pingback: Reinstate your backups! – Rob's Blog