One of many
There are umpteen “set this up” posts out there, so this falls squarely under the dual banners of “what I did” (to remind myself in case I need to set it up again, or describe to someone else), and “why I did it” (also to remind myself).
aka tl;dr: this is how and why i set this up, it should work for you, but you probably want to do your own thing!
InfluxDB
The middle initial is at the centre of the setup- without storage you can’t get data in or out, so we’ll start there.
There is an official Docker image for InfluxDB, and the untruncated generated readme can be found over on GitHub- we want the ‘running the container’ section (which is not obvious- the readme could really use a TOC).
We want to expose pot 8086, and volumes for data (/var/lib/influxdb2) and config (/etc/influxdb2/) for manual (config.yml) and generated configuration.
For initialisation we can use DOCKER_INFLUXDB_INIT_MODE, and set some additional environment variables (with DOCKER_INFLUXDB_INIT_: USERNAME, PASSWORD, ORG, and BUCKET).
We can generate an initial config file via:
docker run --rm influxdb:2.0 influxd print-config > config.yml
And pop that in our config directory.
Traefik labels can be used to create a routed endpoint, though that isn’t needed as yet.
Once the setup has been run once, the environment variables can be dropped from the compose file.
Example InfluxDB docker-compose.yml fragment:
version: "3"
services:
  influxdb:
    image: influxdb:latest
    container_name: influxdb
    environment:
     - DOCKER_INFLUXDB_INIT_MODE=setup
     - DOCKER_INFLUXDB_INIT_USERNAME=bertieb
     - DOCKER_INFLUXDB_INIT_PASSWORD=averygoodsetuppassworduseapasswordmanager
     - DOCKER_INFLUXDB_INIT_ORG=defaultorg
     - DOCKER_INFLUXDB_INIT_BUCKET=defaultbucket
    volumes:
      - ./influxdb2:/var/lib/influxdb2
      - ./influxconfig:/etc/influxdb2
    ports:
       - 8086:8086
    restart: unless-stopped
    # Traefik labels for later
    #labels:
    #  - "traefik.enable=true"
    #  - "traefik.docker.network=traefik_default"
    #  - "traefik.http.routers.influxdbs.rule=Host(`influxdb.bertieb.org`)"
    #  - "traefik.http.routers.influxdb.tls=true"
    #  - "traefik.http.routers.influxdb.tls.certresolver=myresolver"
    #  - "traefik.http.services.infludb.loadbalancer.server.port=8086"
    networks:
      - tignet

networks:
  traefik_default:
    external: true
  tignet:
    driver: bridge
and it should run happily:
Recreating influxdb ... done
Attaching to influxdb
influxdb    | 2021-11-09T13:07:18.019717527Z    info    found existing boltdb file, skipping setup wrapper      {"system": "docker", "bolt_path": "/var/lib/influxdb2/influxd.bolt"}
influxdb    | ts=2021-11-09T13:07:18.208441Z lvl=info msg="Welcome to InfluxDB" log_id=0XiCo0G0000 version=2.1.0 commit=435907d68d build_date=2021-11-04T20:30:56Z
influxdb    | ts=2021-11-09T13:07:18.266242Z lvl=info msg="Resources opened" log_id=0XiCo0G0000 service=bolt path=/var/lib/influxdb2/influxd.bolt
influxdb    | ts=2021-11-09T13:07:18.266879Z lvl=info msg="Resources opened" log_id=0XiCo0G0000 service=sqlite path=/var/lib/influxdb2/influxd.sqlite
influxdb    | ts=2021-11-09T13:07:18.308383Z lvl=info msg="Checking InfluxDB metadata for prior version." log_id=0XiCo0G0000 bolt_path=/var/lib/influxdb2/influxd.bolt
influxdb    | ts=2021-11-09T13:07:18.308725Z lvl=info msg="Using data dir" log_id=0XiCo0G0000 service=storage-engine service=store path=/var/lib/influxdb2/engine/data
influxdb    | ts=2021-11-09T13:07:18.309136Z lvl=info msg="Compaction settings" log_id=0XiCo0G0000 service=storage-engine service=store max_concurrent_compactions=1 throughput_bytes_per_second=50331648 throughput_bytes_per_second_burst=50331648
influxdb    | ts=2021-11-09T13:07:18.309310Z lvl=info msg="Open store (start)" log_id=0XiCo0G0000 service=storage-engine service=store op_name=tsdb_open op_event=start
influxdb    | ts=2021-11-09T13:07:18.310072Z lvl=info msg="Open store (end)" log_id=0XiCo0G0000 service=storage-engine service=store op_name=tsdb_open op_event=end op_elapsed=0.749ms
influxdb    | ts=2021-11-09T13:07:18.310357Z lvl=info msg="Starting retention policy enforcement service" log_id=0XiCo0G0000 service=retention check_interval=30m
influxdb    | ts=2021-11-09T13:07:18.310580Z lvl=info msg="Starting precreation service" log_id=0XiCo0G0000 service=shard-precreation check_interval=10m advance_period=30m
influxdb    | ts=2021-11-09T13:07:18.310938Z lvl=info msg="Starting query controller" log_id=0XiCo0G0000 service=storage-reads concurrency_quota=1024 initial_memory_bytes_quota_per_query=9223372036854775807 memory_bytes_quota_per_query=9223372036854775807 max_memory_bytes=0 queue_size=1024
influxdb    | ts=2021-11-09T13:07:18.314051Z lvl=info msg="Configuring InfluxQL statement executor (zeros indicate unlimited)." log_id=0XiCo0G0000 max_select_point=0 max_select_series=0 max_select_buckets=0
influxdb    | ts=2021-11-09T13:07:18.703083Z lvl=info msg=Starting log_id=0XiCo0G0000 service=telemetry interval=8h
influxdb    | ts=2021-11-09T13:07:18.703121Z lvl=info msg=Listening log_id=0XiCo0G0000 service=tcp-listener transport=http addr=:8086 port=8086
Grafana
Next up is visualisation. There is an official Grafana image, with documentation on its usage from Grafana.
The container requires port 3000. It seems to support the following volumes: /var/lib/grafana/, /etc/grafana, and /var/log/grafana. Those will need appropriate permissions if bind-mapped, or the user adjusted.
Note that you might run into a permissions issue even if these are set properly, see this forum post. It typically reads:
Creating grafana ... done
Attaching to grafana
grafana     | GF_PATHS_CONFIG='/etc/grafana/grafana.ini' is not readable.
grafana     | GF_PATHS_DATA='/var/lib/grafana' is not writable.
grafana     | GF_PATHS_HOME='/usr/share/grafana' is not readable.
grafana     | You may have issues with file permissions, more information here: http://docs.grafana.org/installation/docker/#migrate-to-v51-or-later
grafana     | Error checking server process execution privilege. error: could not get current OS user to detect process privileges
grafana     | t=2021-11-09T14:02:51+0000 lvl=crit msg="failed to parse \"/etc/grafana/grafana.ini\": open /etc/grafana/grafana.ini: no such file or directory"
grafana exited with code 1
I have opened an issue about this on their GitHub. For now, as a workaround, running the :7.5.7 tag works for initial setup.
The default admin user is admin/admin.
An example docker-compose.yml fragment for Grafana:
grafana:
    image: grafana/grafana:7.5.7
    container_name: grafana
    user: "1000:1000"
    ports:
      - 3000:3000
    volumes:
      - ./grafana-data:/var/lib/grafana
      - ./grafana-config:/etc/grafana
      - ./grafana-log:/var/log/grafana
    restart: unless-stopped
    networks:
      - tignet
Testing
At this point I have working InfluxDB and Grafana (albeit v7) containers. Someone mentioned using Glances with the two. So we can use that to test if we’re working right!
First add InfluxDB as as data source in Grafana. To do this with v2, we’ll use the flux query language, rather than InfluxQL. We can grab the credentials (ie token!) from ./influxconfig/influx-configs. ‘Save and Test’ should then report success.
Then, we need to export from Glances to InfluxDB.
To enable this, I need to:
- set up a new service to do
glances --export influxdb2(because “Export is only available in standalone or client mode”) - add a glances.conf file to that glances service
- add that to the same network as the TIG stack
- set up the
[infuxdb2]exporter - tell it to export using influxdb2
- tell it to be quiet (
-q)
The documentation mentions that there is a dashboard (GitHub raw link). However, that dashboard didn’t work for me, complaining with what look like syntax errors:
invalid: compilation failed: error at @1:13-1:22: string literal key cpucore must have a value error at @1:43-1:44: invalid statement: $ error at @1:69-1:78: unexpected token for property key: ILLEGAL ($)
which, at a guess, is due to differences between InfluxQL (old v1 style) and flux (new v2 style).
Side note: this reminds me of starting out with traefik v2, where many examples are still in the v1 format
Thankfully InfluxDB itself offers a data explorer, so we can confirm that it is indeed receiving data:

Some success!
Telegraf
Telegraf has an official Docker image too, so we can use that.
It can generate a sample telegraf.conf (via docker run --rm telegraf telegraf config > telegraf.conf), so we can pass that in in a volume. We can also pass in the docker socket as a volume to permit monitoring of the host Docker engine.
Note that because we’re using v2 of InfluxDB, we need to use a compatible output- the one in the generated config is for v1! Configuration for v2 can be added, however.
For example:
###############################################################################
#                            OUTPUT PLUGINS                                   #
###############################################################################

# Manually added
# see https://docs.influxdata.com/influxdb/v2.0/write-data/no-code/use-telegraf/manual-config/

[[outputs.influxdb_v2]]
  urls = ["http://influxdb:8086"]
  token = "$INFLUX_TOKEN"
  organization = "bertieorg"
  bucket = "telegraf"
Note: To use the ping plugin in either native or exec mode, I had to setcap cap_net_raw+ep /usr/bin/telegraf to avoid the complaint:
E! [inputs.ping] ping failed: permission changes required, enable CAP_NET_RAW capabilities (refer to the ping plugin's README.md for more info)
See this issue for more info. (42 minutes old at time of writing!)
We can then use that info — or any of the default captured info — to create a test dashboard in Grafana. Helpfully, the flux query from InfluxDB’s data explorer can be copied and pasted:
from(bucket: "telegraf")
  |> range(start: v.timeRangeStart, stop: v.timeRangeStop)
  |> filter(fn: (r) => r["_measurement"] == "ping")
  |> filter(fn: (r) => r["_field"] == "average_response_ms")
  |> aggregateWindow(every: v.windowPeriod, fn: mean, createEmpty: false)
  |> yield(name: "mean")
Which gives us a nice test graph:
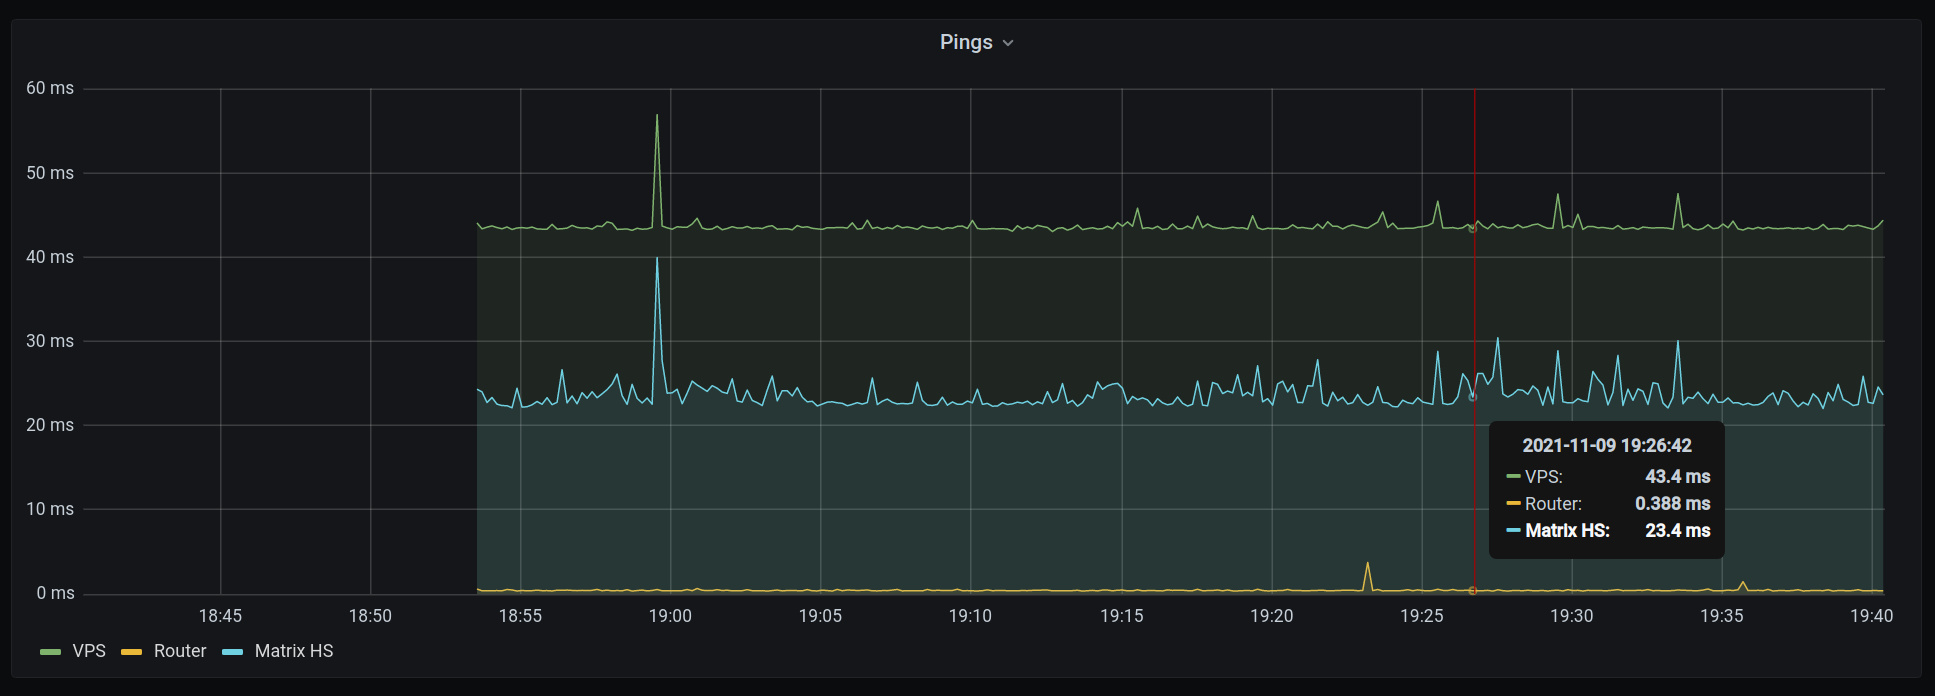
More success!
Pingback: “Why isn’t my Docker bind mounted file updating from host to container when I make changes with vim?” – Rob's Blog
Pingback: My First Panel in Grafana (+ Telegraf & InfluxDB2) – Rob's Blog
Pingback: Line Count Over Time: From Historical Collection to Graphing – Rob's Blog
Pingback: Monitoring ZFS Latencies in Proxmox (Part 1) – Rob's Blog