Toddling along
After setting up my TIG (Telegraf-InfluxDB2-Grafana) stack, there were a few tweaks I had to make to get things up and going.
My goal was to do something simple to get started – get a graph of Matrix homeserver pings, like JMG has:

Pretty simple, in theory.
Telegraf
I set up the ping plugin in telegraf. Rather than collect every 10s (the default agent interval), the interval setting can be configured for ping separately. For example:
[agent]
 interval = "10s"
 flush_interval = "10s"

[[inputs.ping]]
 urls = ["8.8.8.8","8.8.4.4"]
 interval = "5m"
 count = 1
 timeout = 5
I then set up the influxdb2 exporter, and confirmed data was arriving in the bucket.
While other agent data was arriving was, ping wasn’t working! In Docker the telegraph binary needs CAP_NET_RAW. This can be set by getting a shell in the container and running setcap cap_net_raw+ep /usr/bin/telegraf.
InfluxDB
Using the data explorer in InfluxDB made it easy to set up the graph query. I made a couple of tweaks, however:
- use
|> group(columns: ["url"])to get a ‘nice’ legend, rather than a json object (likeaverage_response_ms {host="telegraf", name="ping", url="chat.lupinenet.com"}) - change
createEmptyto true- this is useful for ping to show times when there is no response (ie change the penultimate operation to|> aggregateWindow(every: v.windowPeriod, fn: mean, createEmpty: false))
To take advantage of being able to set a threshold for when to ‘bridge the gap’ on missing data, I changed to the latest image (8.x branch) from 7.5.7, so that I can use the new time series visualisation options for connecting null values:

Grafana
Setting up the homeserver ping graph was as simple as copying over the query from InfluxDB.
Then to make it viewable anonymously, I created a new organisation for guests (so that no login is required), which seems to be the approved way to do it (cf [1], [2], [3]). Note that some options need to be set in grafana.ini:
[auth.anonymous]
enabled = true
org_name = Guests
org_role = Viewer
Once that is set up the panel / dashboard can be created for that org. I recreated the panel by copying over the JSON definition.
URL Config: When I was trying to change organisation in Grafana, it would try to send me to http://localhost:3000, rather than the subdomain I was hosting at. I had to set root_url so that it would serve the correct URL.
The Result
The result looks nice:
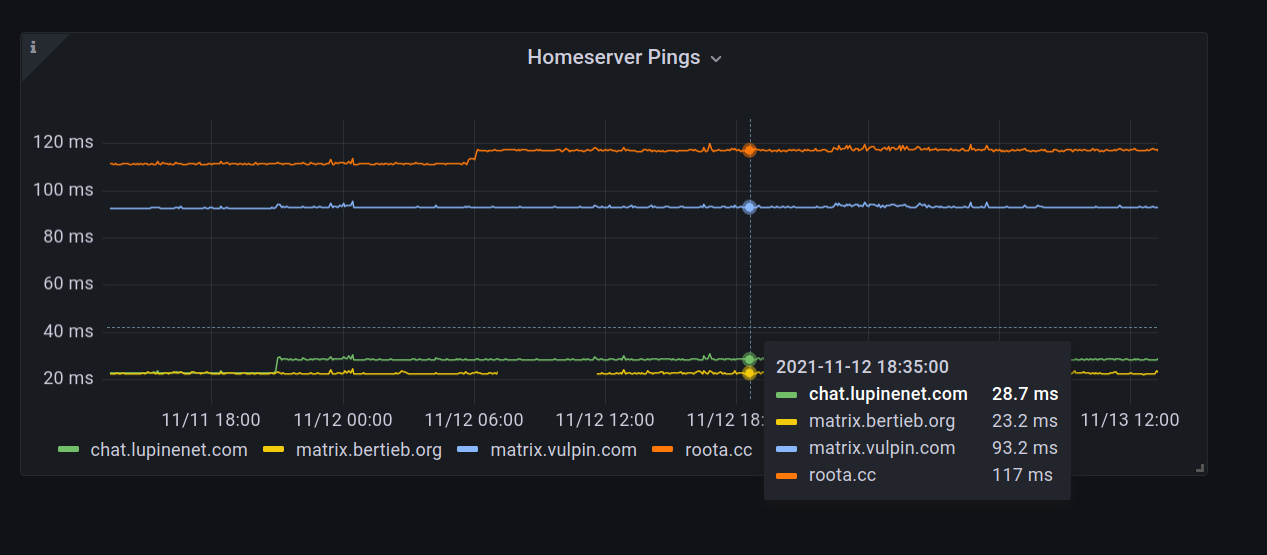
Sensible interval? ? Sensible labels? ? Gaps in pings show up? ? Viewable by folks other other HS’s? ?
That’ll do for now!
Would you be able to build out other “nice to haves” for this influxdb2 grafana dashboard and post it to the Community Dashboards for Grafana?